Dedicated Healthcare Dashboard Portal

Dedicated Healthcare Dashboard Portal

The unfortunate COVID-19 pandemic led to the need for the development of a data dashboard that depicts control charts, improvement methods, reported deaths by tracking trends in the clinician activity, and patient health across the nation and globally.

Capability

Digital Services

Industry

Healthcare

Country

US

Key Features

The intuitive dashboard offers real-time information and data visualization about corona pandemic with the latest healthcare data trackers capturing the propagation of COVID-19.

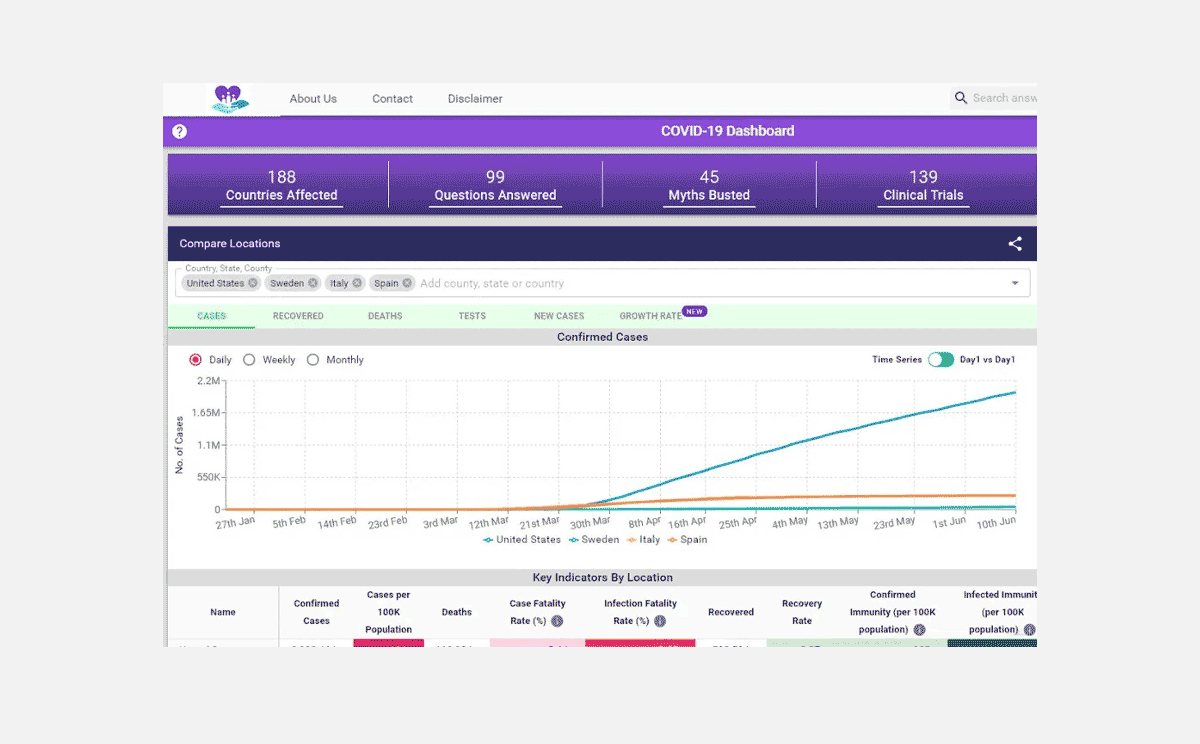
Real-time visualization of the spread

The single point dashboard presents various elements like the summary of overall spread, cases by region, with real-time information on recovery, deaths, tests done, new cases and more

Location comparison of spread – Region/Country wise

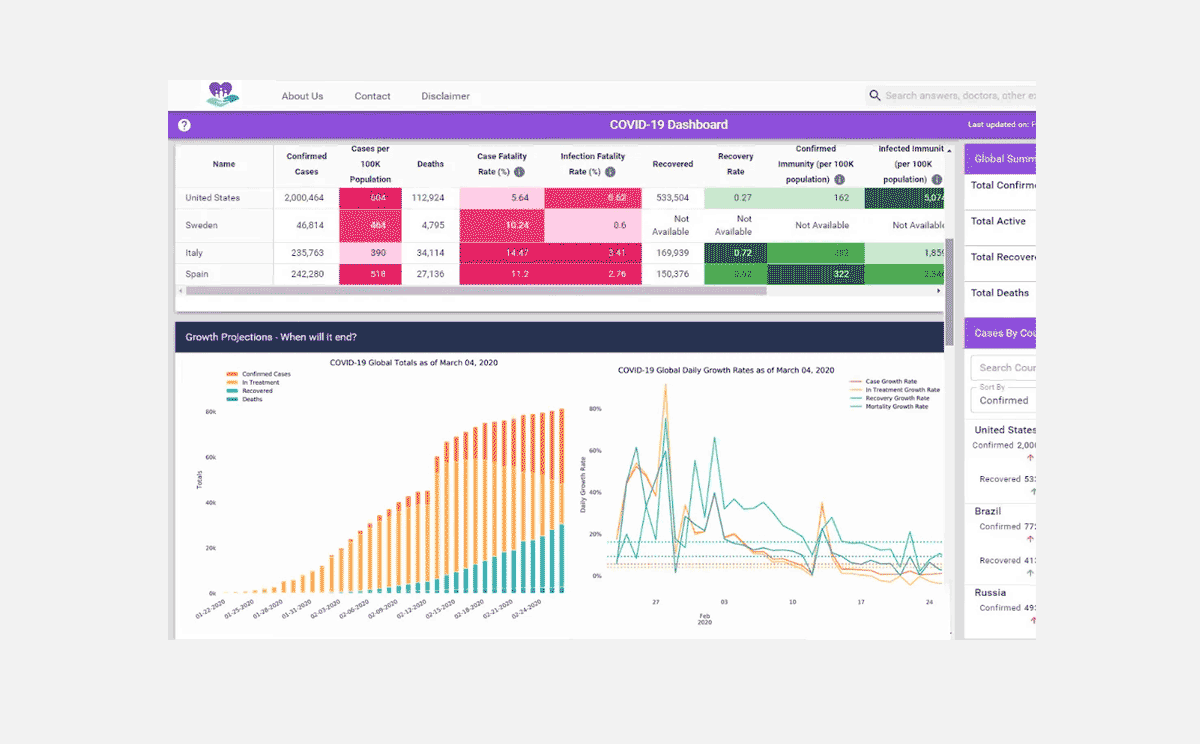
Apple-to-apple comparison between locations, in terms of how well those places are doing with testing and cases concerning the overall population

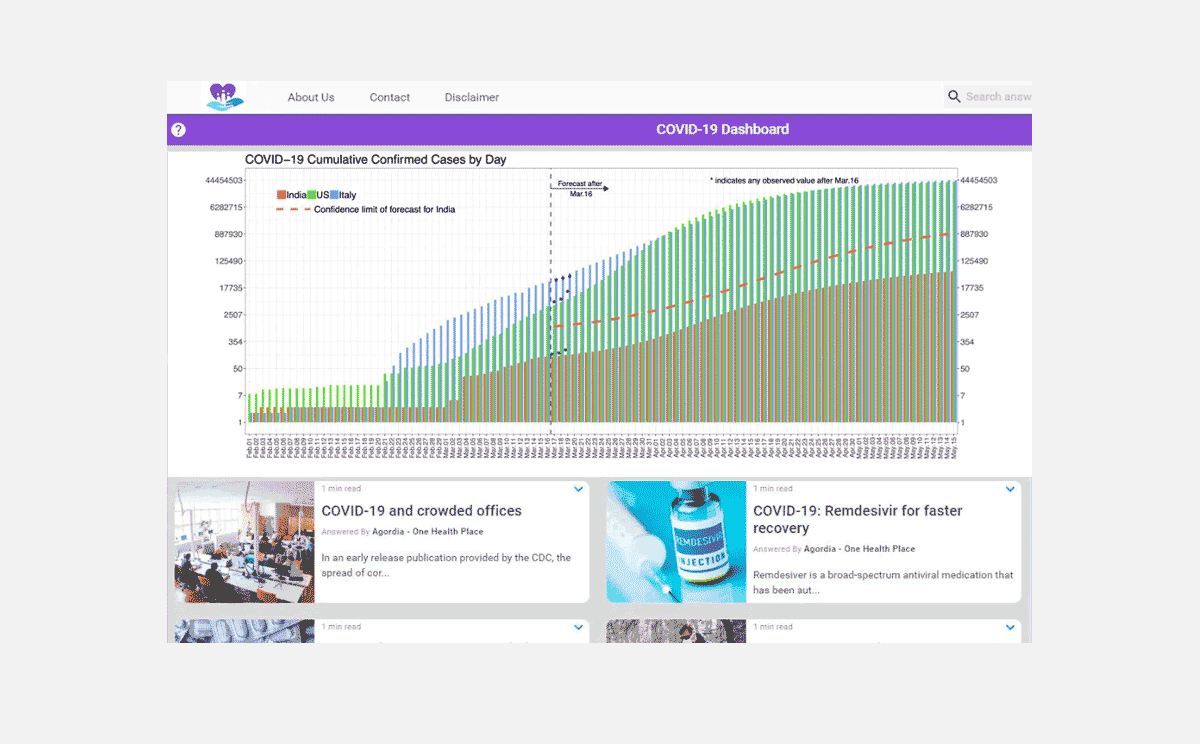
Visual projection of pandemic control

Graphical projection of corona outbreak based on the location’s historical testing and growth rates, and also known attributes of SARS-CoV-2

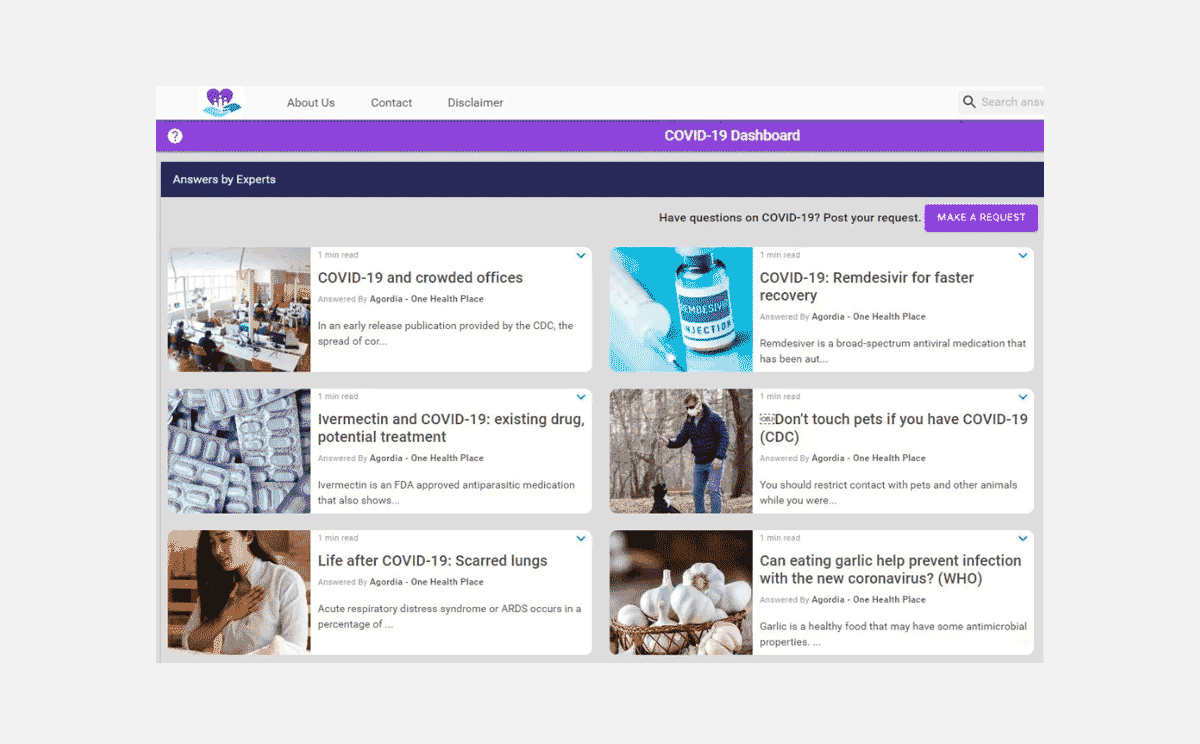
Answers from experts

Personalized response on COVID-19 related queries in a byte-sized, easy-to-consume format with notification when experts answer them

Challenges

No experience or intelligence on historical data as the virus and spread is new to the world

Unsure of what parameter and insight is valuable to showcase

Lack of understanding on how get traffic on the dashboard

Using the traffic trend to determine what further can be enhanced in terms of features

Solutions

With a structured approach, yet under a strict deadline considering the global situation, the solution was made live. It was with consideration of project elements like – KPIs development, information source validation & data generation, integration with multiple data sources, and more.

Statistical model to predict pandemic end

Estimation and representation of patient impact with region wise breakup of new cases vs. the projected ones predicting possible end of the spread

Clinical trial data

Real-time data representation of clinical trials conducted for a variety of medication provisions across categories

Social integrations

With the right third-party integrations, the dashboard offers the capability to connect with healthcare experts for answers and share statistics on the pandemic spread through social media

Fact-checker

The dashboard helps bust myths by providing users with a graphical display of information and validated content from subject matter experts

Outcomes

~ 0 %
accurate data comparison of the growth & mortality rate

Accurate

information from credible sources avoiding miscommunication

Multiple

custom views and granular insights filter by location

Technologies Used

AWS
MongoDB
Next.JS
Node.js

Project Snapshots

Recent Case Studies

Optimize your cloud infrastructure, implement robust solutions, and stay ahead of trends with our resource hub.