
The need to prepare your business for a data-driven world is becoming more evident than ever. Business intelligence (BI) tools help businesses understand their data and gain insights to improve performance across different business functions. As businesses expand, they are dealing with more data than ever. Traditional BI tools are useful for tracking performance and understanding past trends, but they may not be enough to support faster and more informed decisions.
This is where Microsoft augmented analytics can make BI smarter. Businesses are increasingly exploring it to gain deeper insights, identify patterns, and make better decisions using their data. The growing interest is clear. According to fortune business insights, the global augmented analytics market size is projected to reach USD 113.43 billion by 2034, growing at a CAGR of 24.2% from 2026 to 2034.
But how exactly does augmented analytics make business intelligence smarter, and what can it mean for your business? Let’s take a closer look.
Key Capabilities of Augmented Analytics That Enhance BI
Enterprise Business Intelligence has already made data collection, tracking, and analysis easier. Microsoft augmented analytics builds on these capabilities by using AI and Machine Learning to automate parts of the analytics process, identify patterns, and surface insights that may otherwise go unnoticed. Let’s look at the key capabilities of augmented analytics for BI.
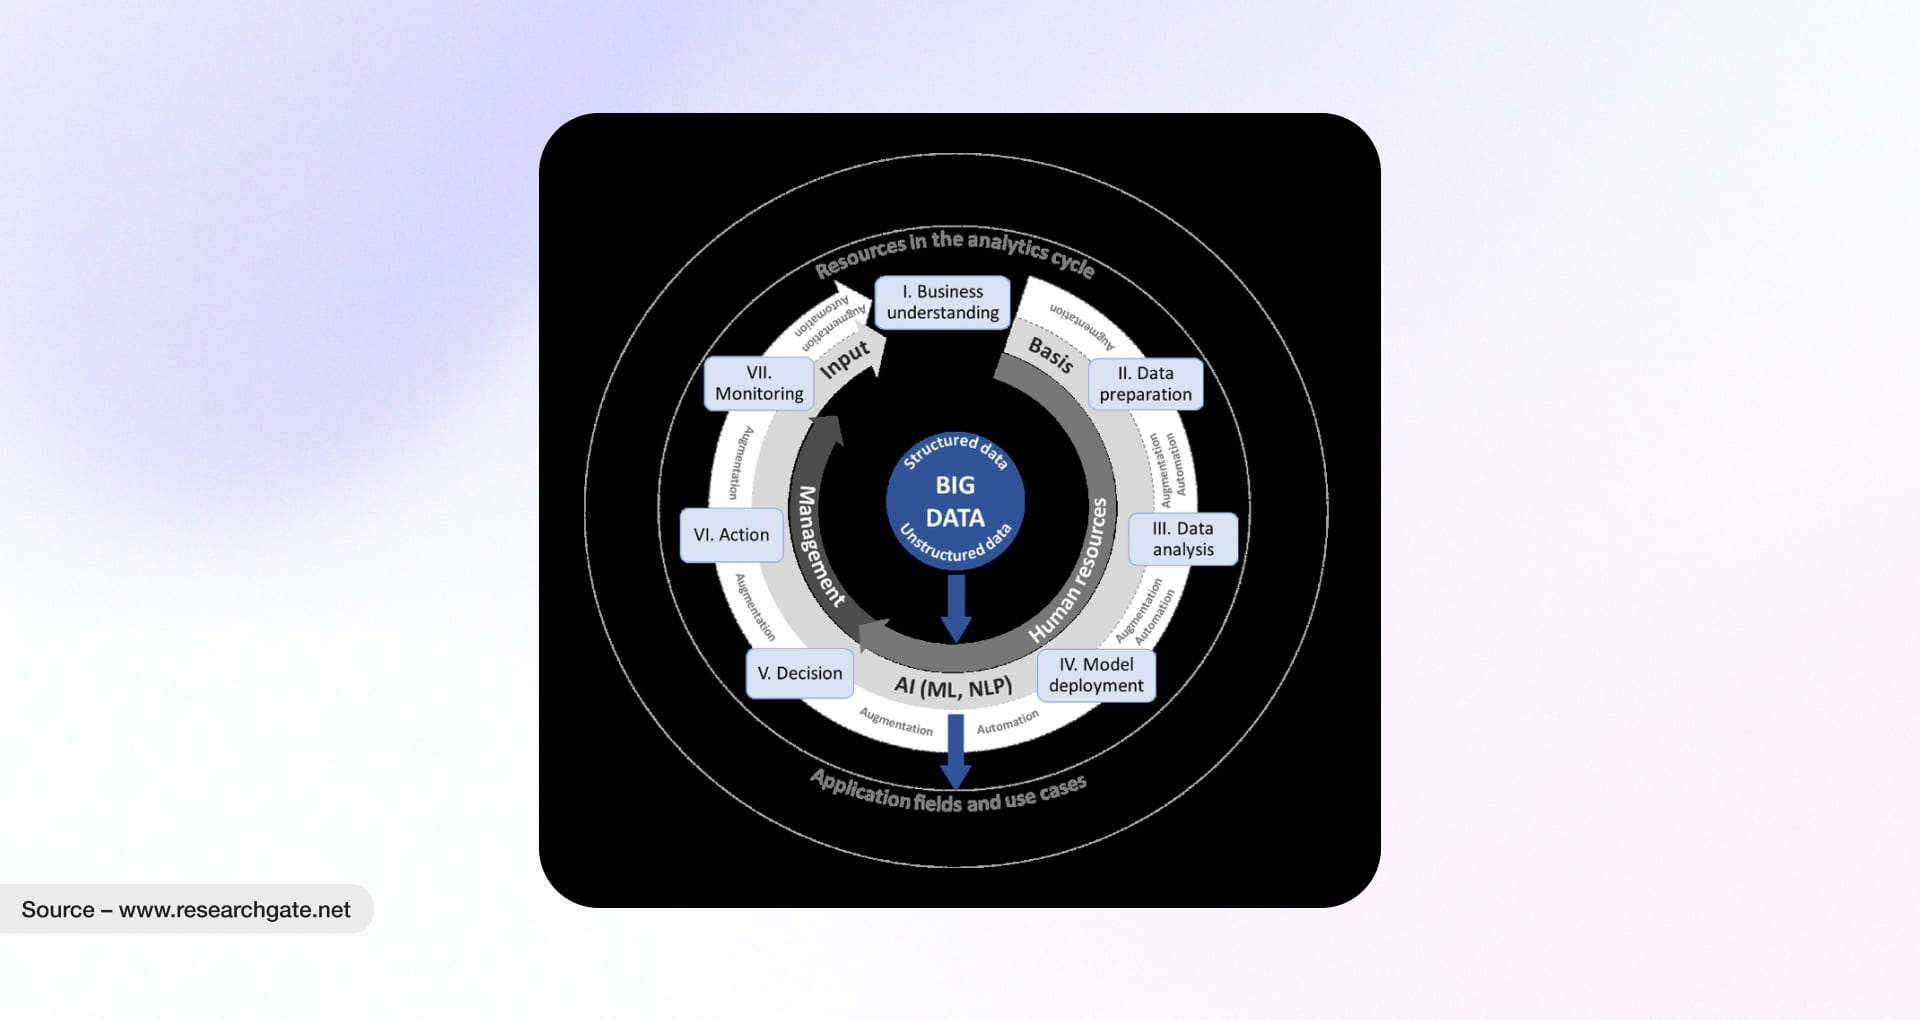
Image source: researchgate.net
1. Automated Data Preparation and Discovery
Having data from a variety of sources is one challenge. The bigger challenge is often preparing and analyzing it. Augmented analytics helps reduce this effort by automating tasks such as data cleansing, identifying inconsistencies, and highlighting relationships between data points. This helps address some of the common obstacles that slow down data analysis.
2. Natural Language Queries
Why use complex queries when you can simply ask questions? With natural language processing (NLP), AI augmented analytics allows business users to ask questions about their data in everyday language, such as how sales are performing, what customers are buying, or how revenue has changed. Users can also ask more specific follow-up questions to explore the data further.
3. Machine Learning Insights & Anomalies
Sometimes, there are patterns or changes in data that you may not know to look for in a BI dashboard. For example, a sharp decline in sales or unusual activity across transactions and customer behavior may go unnoticed. Augmented analytics uses statistical methods and machine learning to identify such anomalies and flag them for further investigation. This helps teams understand where something has changed and investigate the possible reasons behind it.
4. Predictive Analytics
Knowing how your business has performed in previous periods is useful. However, planning for the next quarter requires looking ahead. Augmented analytics in Business Intelligence can use Machine Learning, along with sales trends, seasonal patterns, and other relevant variables, to forecast demand. These insights help business teams plan resources, prepare for changing demand, and work towards their growth targets.
5. Automated Visualizations
Having multiple dashboards can make it difficult to decide which numbers need attention. Knowing where to focus can be tricky when data is spread across different reports. AI augmented analytics can recommend relevant visualizations, highlight statistical patterns, and, depending on the BI platform, provide explanations of changes in performance. This makes it easier for business users to spot trends and investigate areas that need attention.
Key Business Benefits of Augmented Analytics in Business Intelligence
Adding Microsoft augmented analytics to the business intelligence workflow can make a difference through automation, better use of data, and improved visibility. It helps businesses reduce repetitive manual work, give teams easier access to insights, and identify potential risks and opportunities earlier.
1. Faster Decision-Making
Every business decision matters, whether it is about managing a potential risk or supporting growth. Delays can affect how quickly teams respond to changing conditions. Augmented analytics for Business Intelligence helps make relevant insights more accessible by highlighting ongoing patterns, key trends, and changes in business performance. This gives teams useful information to make decisions with greater confidence.
2. Less Time Spent on Data Analysis
Data analysis teams play an important role in businesses, and their time needs to be used effectively. Augmented analytics brings together AI, machine learning, and natural language capabilities to automate parts of the analysis process. Tasks that once required hours of manual effort, such as exploring data, identifying patterns, or investigating unusual changes, can take much less time. This allows teams to spend more time on complex analysis and business priorities.
3. A Clearer View of Business Performance
Reports show that a change has occurred, but understanding the reasons behind it often requires further analysis. Augmented analytics helps teams explore contributing factors behind changes in business performance. As a result, they can identify potential risks, understand emerging patterns, and spot opportunities that need attention.
4. Easier Access to Business Insights
Business users should be able to find answers without relying on data specialists for every query. Augmented analytics makes this easier by allowing employees to explore data and ask questions in natural language. This improves access to relevant insights across departments and helps teams use data in their day-to-day work.
5. Better Use of Existing BI Investments
Businesses have already invested in BI tools, and replacing existing systems can be expensive and disruptive. Many modern BI platforms offer built-in augmented analytics capabilities or support integration with additional analytics tools. This means businesses may be able to extend their existing setup rather than replace it entirely. By making better use of their available data, tools, and infrastructure, they can get more value from their BI investments.
Augmented Analytics Use Cases Across Industries
Augmented analytics can support different business functions by helping teams identify patterns, investigate changes, and make better use of available data. Its applications vary by industry, depending on the data businesses work with and the decisions they need to make. Here are some practical examples.
1. FinTech: Real-Time Risk & Fraud Intelligence
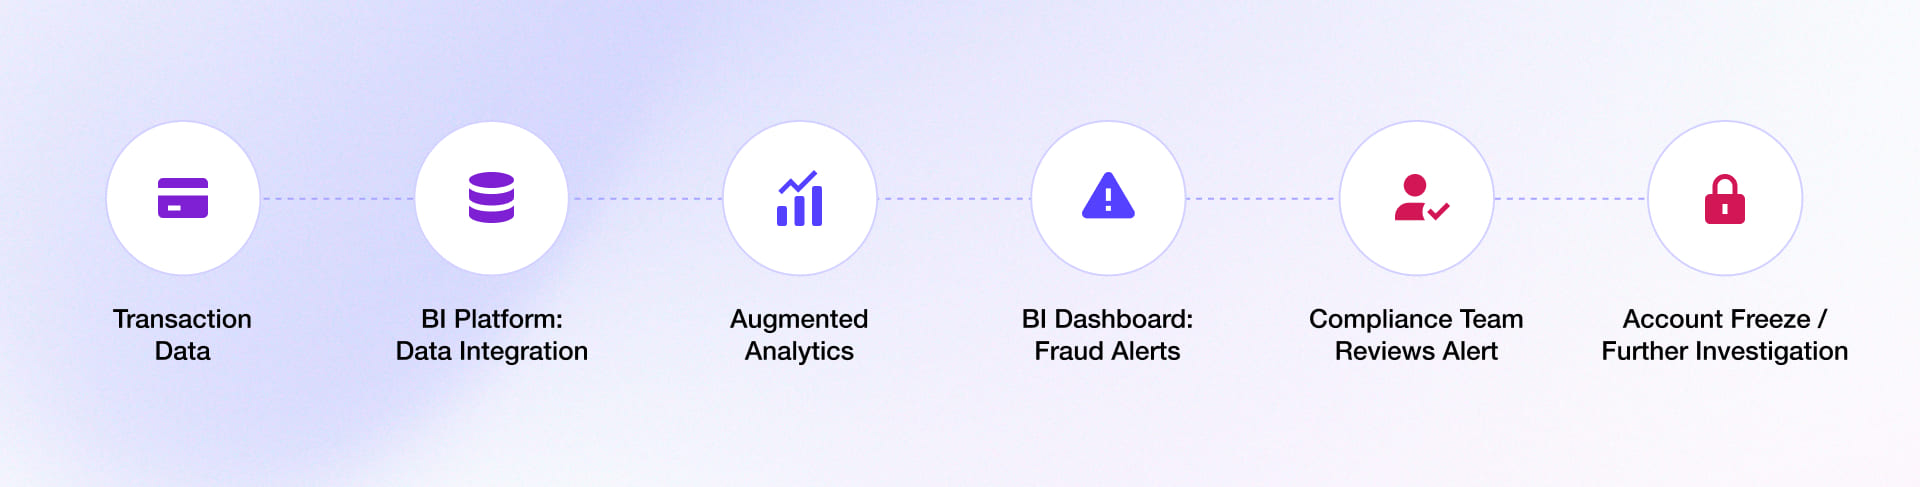
Quick identification and resolution of suspicious activities are key priorities in the FinTech industry. Augmented analytics can help financial institutions monitor transaction patterns, identify unusual activity, and bring potential risks to the attention of fraud and compliance teams. Using machine learning and statistical analysis, it can flag transactions that deviate from expected patterns and provide additional context for investigation.
|
Practical Use Case |
Technical Process | Operational Action |
Business Outcome |
| Synthetic Identity Fraud Detection | Machine learning models analyze identity attributes, device information, IP addresses, and transaction patterns to flag potentially suspicious activity. | Fraud teams review alerts, investigate suspicious accounts, and take appropriate action. | Helps identify potential synthetic identity fraud earlier and reduce manual screening effort. |
| Dynamic Credit Underwriting | Models analyze credit history, cash flow, income patterns, and other relevant financial data to support risk assessment. | Loan teams review risk scores and supporting insights before making lending decisions. | Supports faster, more consistent credit assessments while retaining human oversight. |
2. AdTech: Programmatic Bidding & Campaign Optimization
AdTech teams manage millions of bid requests and rapidly changing campaign performance across multiple demand-side platforms (DSPs). Manual CSV exports and bid adjustments can struggle to keep pace with creative fatigue, audience changes, and shifting cost-per-acquisition (CPA) trends.
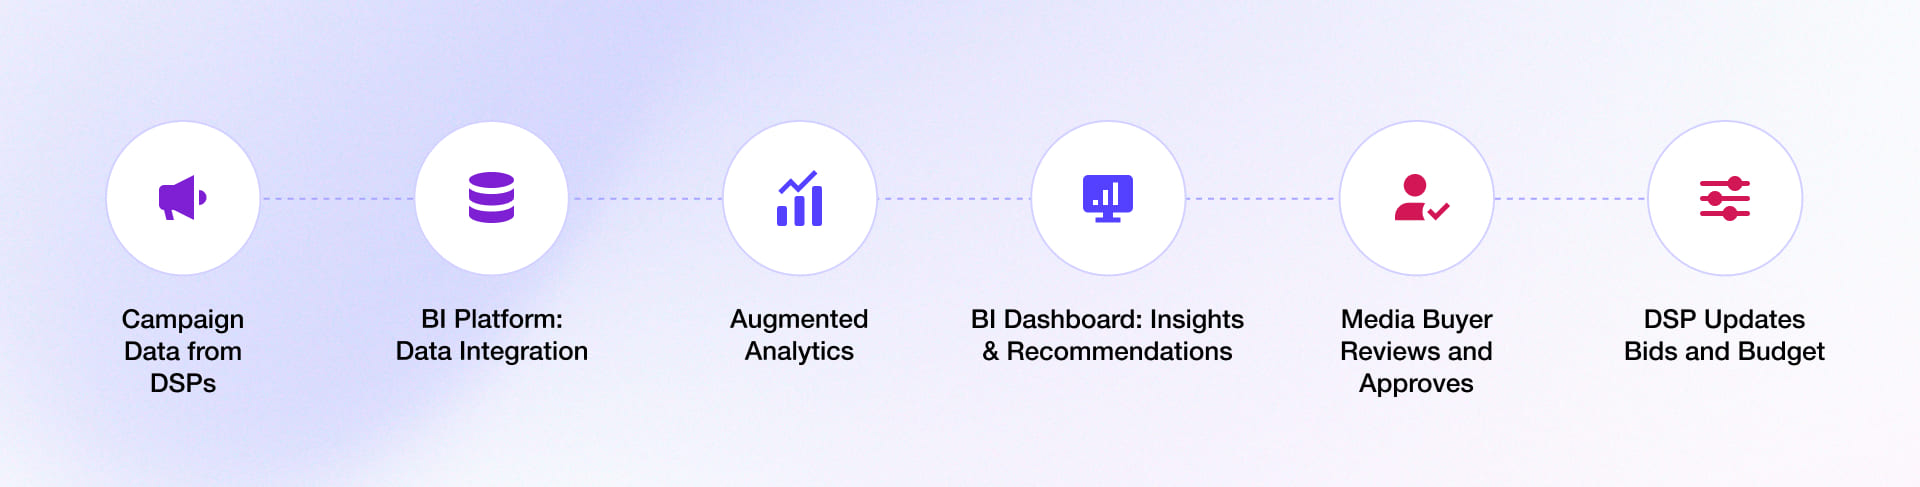
Workflow: Detecting Bid Fatigue and Reallocating Budget
|
Stage |
Manual BI Process |
Augmented BI Process |
| Detection | Media buyers review platform reports and notice declining click-through rates (CTR). | Machine learning models monitor CPA, CTR, frequency, and conversion trends to flag unusual changes. |
| Diagnosis | Analysts manually compare audiences, creatives, and placements to investigate the decline. | Augmented analytics tools highlight likely contributing factors, such as creative fatigue within a specific audience segment. |
| Action | Buyers export data, recalculate budgets, and update the DSP. | Buyers receive recommendations for budget adjustments and review them before approving changes. |
| Outcome | Campaign optimization may be delayed, resulting in continued spend on underperforming segments. | Teams can respond faster and make more informed budget allocation decisions. |
3. Digital Manufacturing: Predictive Maintenance and Optimization
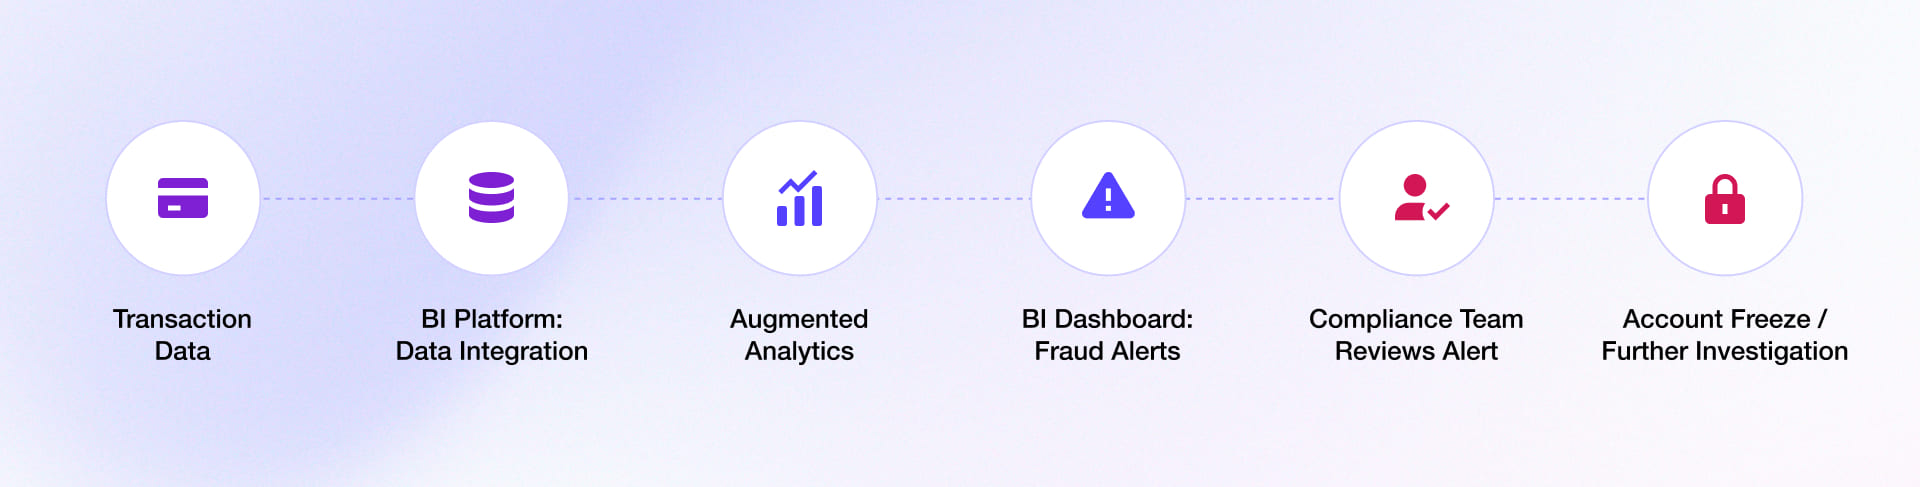
Reducing downtime, improving safety, and identifying operational risks before they affect production are key priorities in digital manufacturing. AI augmented analytics helps manufacturers monitor equipment health, track production performance, and identify early signs of potential failures. Machine Learning models can analyze operational data, including equipment temperature, vibration, and production trends, to flag issues that need attention.
|
Practical Use Case |
Technical Process | Operational Action |
Business Outcome |
| Predictive Equipment Maintenance | Machine learning models analyze machine temperature, vibration, and other sensor data to identify patterns associated with potential equipment failure. | Maintenance teams receive alerts, investigate the issue, and plan repairs before equipment breaks down. | Helps reduce unplanned downtime and improve equipment reliability. |
| Yield and Defect Analysis | Analytics models examine production data, material usage, machine settings, and defect patterns to identify factors associated with production waste. | Plant supervisors investigate the findings and adjust production settings where needed. | Helps reduce scrap, improve product quality, and optimize production efficiency. |
4. Retail: Dynamic Pricing & Inventory Balancing
Retailers need to manage profit margins while responding to changing customer demand, competitor prices, seasonal trends, and stock levels. Augmented analytics can help retailers analyze sales trends, monitor inventory, and identify opportunities to adjust prices and stock allocation based on market conditions.
Workflow: Automated Markdown and Localized Allocation
|
Practical Use Case |
Technical Trigger & Machine Process | Ground-Level Operational Action |
Business Outcome |
| Dynamic Markdown Optimization | Models analyze sell-through rates, seasonal demand, local weather, and competitor price signals to identify products that may need price adjustments. | Category managers review recommended price reductions and approve targeted markdowns instead of applying broad discounts. | Helps improve inventory turnover and reduce the need for emergency markdowns. |
| Localized Inventory Balancing | Forecasting models identify regional demand differences and flag potential stockout or overstock situations. | Supply chain teams review recommended stock transfers between locations and take action where needed. | Helps balance inventory across locations, minimize stockouts, and reduce excess stock. |
How to Implement Augmented Analytics in Existing BI Systems
Implementing augmented analytics starts with understanding what your existing BI system can support and where AI can improve the way teams work with data. The objective is to add capabilities such as automated data preparation, predictive analytics, and natural language queries without rebuilding the entire reporting environment.
Here are five steps to consider when integrating augmented analytics into existing BI systems.
1. Assess Your BI Environment and Establish a Unified Data Foundation
Begin with your existing data architecture. Review how data moves between ERP, CRM, databases, and BI tools, and identify gaps in data access, reporting, and integration. These are the initial steps for Business Intelligence implementation.
Key actions to focus on:
- BI Assessment: Review current dashboards, data pipelines, APIs, and integration capabilities.
- Semantic Layer: Define common business metrics and KPIs using tools such as dbt MetricFlow, Cube, or native BI semantic models.
- Use Case Selection: Identify reporting tasks where automated insights, forecasting, or anomaly detection can reduce manual effort.
For example, sales and finance teams should use the same revenue definitions before introducing AI-generated reports.
2. Improve Data Quality and Preparation
AI models depend on the data they receive. Incomplete records, inconsistent formats, and outdated information can affect the accuracy of analytical results. Data preparation should therefore be addressed before adding advanced analytics capabilities.
What to prioritize:
- Automated Data Cleaning: Identify missing values, duplicates, and inconsistent records.
- Data Integration: Connect structured and unstructured data from relevant business systems.
- Data Monitoring: Track data freshness, pipeline failures, and unexpected schema changes. Here, you can keep data engineering best practices at the core.
Tools such as dbt, Apache Airflow, and data quality frameworks can support these activities, depending on the existing architecture.
3. Integrate Automated Analytics and ML Models
Once the data is ready, connect machine learning capabilities to existing BI workflows. Start with a few practical applications, such as sales forecasting, anomaly detection, or customer churn prediction.
Key technology choices:
|
Analytics Capability |
Technology Options |
Business Application |
| Predictive Analytics | BigQuery ML, Databricks | Forecast sales and customer demand |
| Anomaly Detection | Python ML models, Azure ML | Identify unusual transactions or performance changes |
| Automated Insights | Built-in BI analytics, custom ML models | Highlight trends and changes in KPIs |
The right choice depends on the BI platform, available data, and whether the business needs built-in features or custom models.
4. Introduce Natural Language Analytics
This can be achieved by using natural language analytics. For example, a regional sales manager may wish to find out why their revenue has decreased in the west region last month. The system can look at the data and provide a summary of the findings along with figures.
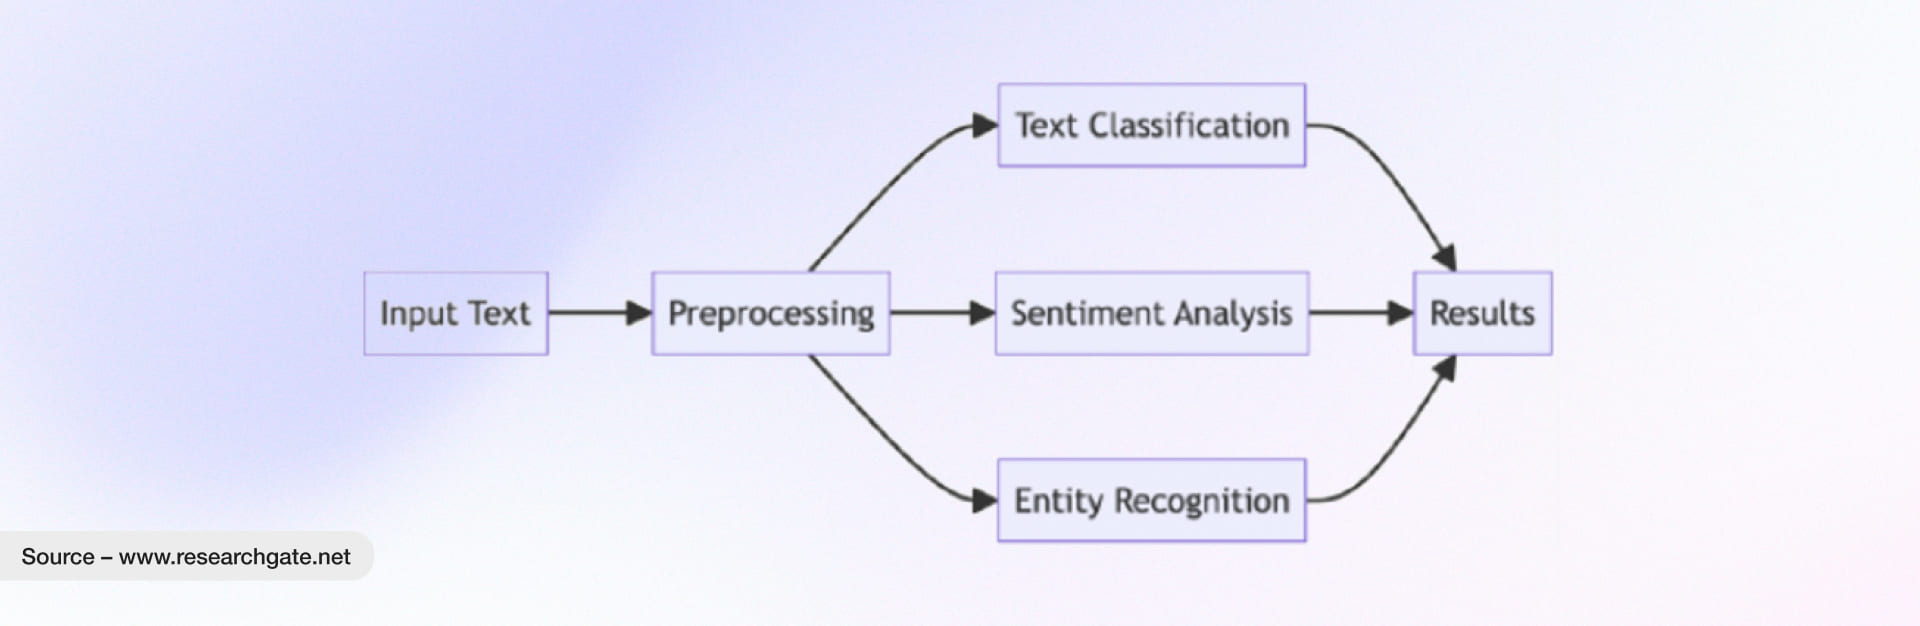
Image source: researchgate.net
Key actions to focus on:
- Natural Language Queries: Connect NLP capabilities to approved business datasets.
- Automated Summaries: Generate explanations for changes in business metrics.
- Response Validation: Check generated answers against governed data and KPI definitions.
This gives business teams another way to work with data while keeping established reporting controls in place.
5. Apply Governance, Test Performance, and Scale
As is typically preferred by business and technical teams, it is best to first test everything internally. Then start with a small group of users and ask business related questions. Test the system in various ways. After testing you can look at the real results and compare to what was expected. Do they meet your business expectations? Are they accurate? And most importantly, do they provide meaningful insights that your team can actually use?
And once your solution is live and in operation, don’t let it become outdated. Keep improving and updating it over time with the support of the right Business Intelligence Services provider.
Measure implementation success through:
| Metric |
What to Measure |
| Time to Insight | Time required to answer business questions |
| Reporting Effort | Reduction in manual data preparation and reporting |
| Insight Accuracy | Agreement between AI-generated results and validated business data |
| User Adoption | Number of teams actively using augmented analytics |
Take a Step Forward with Rishabh Software’s BI and Data Analytics Expertise
Extending your existing BI environment with augmented analytics requires the right approach to data, technology, and integration. At Rishabh Software, we help businesses strengthen their analytics capabilities through augmented Business Intelligence consulting services and Data and AI services.
This includes assessing data readiness, existing BI tools, integration requirements, and governance needs to identify a practical approach to adopting augmented analytics. Our Microsoft Technology services work with businesses to understand their requirements and identify solutions that align with their data environment and business goals.
Looking to get more value from your existing BI setup? Email our team to discuss your requirements and explore the right approach.
Frequently Asked Questions
Q. How do we measure ROI for Microsoft augmented analytics in BI?
A: You can measure ROI by tracking how much time your teams save on reporting, how much you reduce operational costs, and how quickly business decisions are made. Compare these improvements with your implementation and ongoing costs to see the actual value your investment brings.
Q. How does augmented analytics differ from traditional Business Intelligence?
A: Traditional business intelligence relies on predefined reports, dashboards, and manual analysis to understand data. Augmented analytics uses AI and Machine Learning to automate tasks such as data preparation, pattern detection, and insight generation. This helps teams identify trends, uncover hidden insights, and make informed decisions with less manual effort.
Q. How does augmented analytics use AI and Machine Learning?
A: Augmented analytics uses AI and Machine Learning to analyze large datasets, identify patterns, detect anomalies, and generate insights. It can also use natural language processing to help users ask questions about their data in everyday language. This makes data analysis faster and helps teams find relevant insights without relying entirely on manual analysis.
Q. Can AI augmented analytics help business users analyze data without technical expertise?
A: Yes. AI augmented analytics makes data analysis more accessible through features such as natural language queries, automated insights, and interactive dashboards. Business users can ask questions, explore trends, and understand data without writing complex queries or depending on technical teams for every analysis.