
As global disruptions affect manufacturing operations, innovative and effective use of data is key to a sustainable and profitable business. According to a report by The World Economic Forum[1], manufacturing executives consider using advanced analytics to be more critical for success today.
Connected devices in today’s factories generate millions of petabytes of data. Your ability to harness this data using Business Intelligence tools is critical to your success in a revolutionary industry 4.0 era.
Using powerful Business Intelligence tools like Power BI in manufacturing industry helps unlock new insights from massive amounts of data to drive efficiency and new revenue models. Manufacturers worldwide successfully use Power BI to create data culture to improve forecasting, accelerate product innovation, improve operational efficiency, and create new business opportunities.
In this blog, we explore how manufacturers can leverage Power BI for manufacturing industry to uncover powerful insights and turn straws of data into gold. We will also discuss real-life use cases of how Power BI is helping manufacturers and suppliers to drive revenue, save costs, and improve productivity.
Why Should Every Manufacturer Use Power BI?
Data is one of the core drivers of manufacturing 4.0 transformation. According to Deloitte’s 2023 Manufacturing Outlook[2], 60% of surveyed manufacturers ranked data analytics as a key technology focus area to increase operational efficiency over the next 12 months.
It’s not surprising that enterprise manufacturing intelligence is estimated to reach US$11.4 Billion by 2030 from US$3.4 Billion in 2022[3].
However, success in the manufacturing industry does not come from having the data but from what one does with the data. Power BI for manufacturing helps overcome this challenge and empowers manufacturers to grow confidently. Here are some common challenges that manufacturing businesses face at present that act as obstacles to fully leveraging the benefits of data:
Siloed Data Across Disparate Systems
Manufacturing businesses often have legacy and disparate systems and processes with valuable siloed data. Moreover, data in each system is in different formats and generally inconsistent. Sharing and integrating this data is often challenging, giving rise to data silos that prevent gaining visibility and control of operations. This slows decision-making because it takes substantial time to get the information needed.
Data across different systems should be able to integrate seamlessly with each other to enable accurate information. This allows the manufacturing entity to identify the issue and resolve it immediately. Using Data visualization and BI tools like Power BI integrates intelligent data to access information and achieve greater control over the manufacturing process through one single source of truth platform.
Lack of Quality Filtering Process
Complex production systems in a manufacturing facility generate huge amounts of data which can initially seem overwhelming. If not properly optimized, the data can be more of an obstacle than an opportunity. Usually, integrating manufacturing analytics data with conventional legacy systems and ERPs is often challenging and resource intensive. A powerful data visualization and analytics tool like Power BI helps teams across the organization create stunning reports and interactive data visualizations with ease, which increases productivity.
Integrating Manufacturing Analytics
Many manufacturing facilities have adopted Industry 4.0’s smart factory approach and run many intelligent devices. Integrating manufacturing analytics across diverse, legacy, large ERPs, production systems, and project management tools is often challenging. Moreover, as there are multiple processes in manufacturing, it is a challenge to analyze and derive insights because the data captured constantly is inconsistent. Even if collected properly, manufacturing entities often cannot interpret and leverage it correctly. Manufacturing dashboard Power BI is a single source of truth that integrates all the autonomous systems.
How Power BI for Manufacturing Industry Accelerates Digital Transformation
Data visualization and Business Intelligence tools like Power BI help manufacturers reduce data redundancy and improve decision-making.
Gartner ranks Microsoft and Microsoft Power BI as the leader in the Magic Quadrant[4] for Analytics and Business Intelligence platforms. Forrester[5] also named Microsoft and Power BI a leader in the Forrester Wave Augmented BI platforms.
A significant reason for such popularity is Microsoft’s Power BI strategy, which includes the vision, innovation, roadmap, partner ecosystem, ease of adoption, price flexibility, and transparency. Power BI’s broad adoption is also due to its enterprise business intelligence capabilities, NLQ, BI-fabric and governance, collaboration capabilities with MS Teams, security, and compliance.
Key Areas of Manufacturing That Power BI Can Transform

Supply Chain Management
Power BI helps map and monitor inventory levels, supply chain routes, and real-time shipment status to forecast and tackle supply chain disruptions. It combines historical data and present market conditions to generate real-time insights that enable better communication between the manufacturing entity’s suppliers and vendors.
Asset Management
Data disparity and silos in manufacturing facilities make combining ERP business data, maintenance, and operations data in real-time complex. As a result, it is challenging to forecast downtime and manage the asset’s operational expenses risks. Power BI tools can provide real-time data on the health and performance of a production line’s entire fleet of assets. This allows the manufacturer to utilize predictive maintenance to measure and drive maintenance performance to optimum levels.
Quality Control
Power BI allows manufacturers to monitor production line equipment for potential issues or defects by monitoring key KPIs such as production rate, defect rate, and product quality in real time. Thus, by keeping quality control metrics and equipment performance in check, Power BI enables the operations team to take corrective action on time. It also helps meet necessary compliance standards and create a stronger brand reputation.
Last-Mile-Delivery
Traditionally, a major challenge in achieving efficient last-mile delivery has been the absence of valuable insights and visibility across demand forecasting, warehouse inventory levels, product rates, and shipping status.
Power BI empowers manufacturers and offers complete real-time visibility and the ability to integrate data that was once siloed across the factory floor data across and generate insights. With Power BI, it becomes easy to identify and pinpoint any issue to optimize delivery strategy and make last-mile delivery more efficient.
Inventory Forecasting
Stock forecasting plays a key role in meeting customer demands. Power BI manufacturing dashboard allows you to forecast accurate inventory levels for the future and maintain the minimum stock level to meet customers’ demands.
Procurement and Vendor Analysis
Procurement or vendor analysis is a key aspect of any manufacturing business. Implementing Power BI in procurement helps manufacturers use dashboards to efficiently analyze supplier performance and key procurement metrics for real-time access to data and insights. It helps manufacturers use historical data and vendor performance metrics to identify patterns and trends, to optimize procurement.
Similarly, Power BI also enables custom vendor dashboards to monitor KPIs and key vendor metrics such as Vendor Bid analysis, vendor price analysis, vendor cost analysis, and many more. The historical analysis results in better vendor selection helps mitigate risks, and improves overall supply chain efficiency.
Demand Forecasting
Manufacturers need to constantly adapt to the changing customer demands, both business and consumer. Power BI helps stay proactive and sets levels of preparedness. An in-depth analysis of historical sales patterns helps determine and forecast customer demand and future revenue. This, in turn, allows manufacturers accurately project which product line will see a spike in demand and which products will generate the most demand.
Thus, by bringing more transparency and visibility into vendor relationships and performance, Power BI allows manufacturers to assess performance, enhance vendor relationships and identify which vendor can supply raw materials on time. This helps them identify opportunities within vendors and manage vendors efficiently.
Power BI For Manufacturing Industry Benefits
As a powerful Data Visualization and Business Intelligence tool, Power BI brings the predictive power of advanced Data Analytics for small businesses to identify opportunities, improve processes and optimize resources. The user-friendly UI allows your teams to create interactive dashboards and visually interactive reports to analyze and present complex data in an easy-to-understand way.

1. Improves Production Operations Efficiency
Power BI enables seamless integration across disparate data sources. This allows complete visibility to manufacturers and allows them to consolidate data from different sources into one single source of truth. The use of advanced analytics features such as regression analysis, clustering, and forecasting for predictive maintenance helps gain insights into ways to optimize operational efficiency.
The accuracy in reporting helps detect exact bottlenecks and pinpoint areas of low efficiency in the production process by monitoring and analyzing production in real-time.
2. Predictive Analytics
Manufacturers use predictive analytics to forecast demand, estimate production volumes and improve resource allocation to enhance production planning. Power BI’s seamless integration with Azure and Machine Learning helps manufacturers leverage various algorithms such as linear regression, decision trees, and support vector machines. They use these to build and deploy advanced predictive analytics models to gain deeper insights for better business decisions.
3. Inventory Management
Efficient Inventory management ensures you are prepared and well-stocked for trends or spikes in demand. Interactive dashboards and automated reports in Power BI allow detailed analysis with plenty of valuable insights for optimum inventory management. The dashboards make it easy to track inventory levels in the warehouse, stock re-order schedules, and analyze key vendors’ real-time stock-take analysis. At an advanced level, Power BI also helps you with Data Analysis Expressions (DAX) formulas to build data models from historical sales and current stocks to gain valuable insights.
4. Efficient Supply Chain Management
Power BI allows you to import and consolidate data from multiple sources and create a single dashboard for improved visibility. It will enable teams to design customized reports and dashboards for each of the four critical areas of the supply chain – Integration, Operations, Procurement, and Distribution. Power BI’s prescriptive and predictive capabilities further help identify bottlenecks in the supply chain and discover actionable insights. As mentioned above, users can also use Data Analysis Expressions (DAX) to analyze, compare, and forecast information across timeframes and production lines for valuable insights.
5. Improved Decision Making
Research reveals that over 80%[6] of companies rely on stale data for decision-making. Lack of reliable and real-time access to data often leads to incorrect revenue and lost revenue. However, Power BI offers enhanced unified reporting with a customizable interactive dashboard that tracks key metrics for real-time visibility into the business. The increased data visibility helps identify trends and patterns and make data-driven decisions. In addition to the C-suite leadership, Power BI fosters a data-driven culture allowing every employee to access, collaborate and analyze data across your organization.
6. Equipment Assessment
Estimating the machine downtime can proactively improve equipment utilization. Power BI uses data from IoT sensors and connected devices to predict maintenance issues or machine downtime. The data visualization tool can quickly analyze vital factors and data patterns for complete visibility of the health of the equipment.
7. Monitoring Financial Performance
Power BI financial dashboards are one of the most effective reporting tools. Financial dashboards for Power BI can be used to track key financial metrics and the business’s financial performance in an appealing visual format. Power Query in Power BI helps combine large amounts of data from a wide range of data sources and analyze it. Instant insights into business and KPIs like NPA and EBITDA helps estimate a company’s profitability and allow one to compile multiple metrics into a compact report for real-time insights into the health of the manufacturing entity.
Real-life Use Cases of Power BI in Manufacturing Sector
A global material science company wanted to integrate siloed data, provide visualization and quick dashboarding across all levels of the organization to improve decision-making. Using Power BI, Dow[7] employees aggregated and integrated data from various sources across engineering, maintenance, and operations and can now make decisions based on real-time analytics. Using Power BI for manufacturing has helped Dow break data silos by integrating multiple data sources into one single data hub.
Read on to explore popular use cases of Power BI across various industries.
Sandvik Coromant
The Swedish tooling company -Sandvik Coromant[8] is one of the world’s leading suppliers of tools, tooling solutions. The company initially consumed and transformed most data using Microsoft Excel; however, it became difficult for anyone to get a full 360-degree view of sales.
Multiple sources and systems were used to store data, making it difficult to harmonize and consolidate information into one central location for analysis. Sandvik chose Power BI to reduce the total cost of ownership and decrease time-to-market for new functionality.
Power BI provided a 360-degree view of all the business data generated from all corners of operations. Today, Power BI has made it easier for top managers to use reports and has helped the company become data-driven. Power BI helped achieve the overall goal of having efficient and structured data at the core to provide leadership with meaningful and accurate information in a timely way.
SAIC Volkswagen
Shanghai Volkswagen, a leading automobile manufacturing company in China[9] wanted to optimize and use the terabytes of data generated daily in its manufacturing plant.
SAIC Volkswagen’s present digital ecosystem is built on the Power BI platform to improve management and business efficiency. Power BI makes it easy for SAIC Volkswagen to establish connections to various business data sources. This enables business users across the organization to access rich, unified data information, in-depth insights, and accurate, intelligent analysis.
Types of Power BI Dashboards for Manufacturing Industry
Types of Power BI dashboards for manufacturing come in a wide range of processes and operations covered, enabling numerous insight-driven workflows. Based on our research, we’ve identified a few prominent and highly useful Power BI dashboards that can benefit manufacturing businesses of all scales.
Machine Performance Dashboard
If you want to succeed in the manufacturing realm, you must focus on your machines, components, and equipment: their health, performance, and more. For a sustainable business, it’s essential to maintain machinery and ensure an uninterrupted workflow. Gaining insights into these areas can highly transform your approach to managing operations and making decisions. That’s why a Power BI dashboard for machine performance is equally crucial.

If we talk about the above attached dashboard powered by Power BI capabilities, it is a real gem for manufacturers to unlock a real-time view of equipment health by tracking production against targets, machine throughput, downtime reasons, and overall equipment effectiveness (OEE). By relying on these highly data-driven insights, you, as a manufacturing business, can spot the underpoints in the blink of an eye, and further make better plans and strategies to improve maintenance and cost effectiveness along with balancing workload.
Together, these insights help manufacturers:
- Reduce unplanned downtime
- Maintain an uninterrupted production flow
- Allocate resources more effectively
- Improve decision-making for maintenance and investments
Quality Control Dashboard
Developing a product should not just be your strategy, developing a quality-proofed product must be. Maintaining reputation and leading the competition depend on what you deliver to your end users or customers. This aspect can be effectively supported and enhanced with a Power BI-based dashboard. Below is a quick example of a quality control dashboard for your reference.

Consolidated view and information on product quality with highlights of defect trends over time, first pass yield (FPY) levels, and rework volumes across different processes and operations conducted. The visual showcases defect-wise categories, enabling the engineering team to easily identify loopholes that lead to defects and affect product reliability. Just imagine, how things are sorted now for you and your team.
Together, these insights help manufacturers:
- Detect and address quality issues early
- Reduce waste and rework costs
- Improve compliance with quality standards
- Deliver reliable products to customers
Inventory & Supply Chain Dashboard
Small, mid, or large-size manufacturing business you belong to, inventory and its efficient management can drive success at the core and bottom line. A Power BI Dashboard can make your inventory and supply chain processes champions with data-driven and real-time insights.
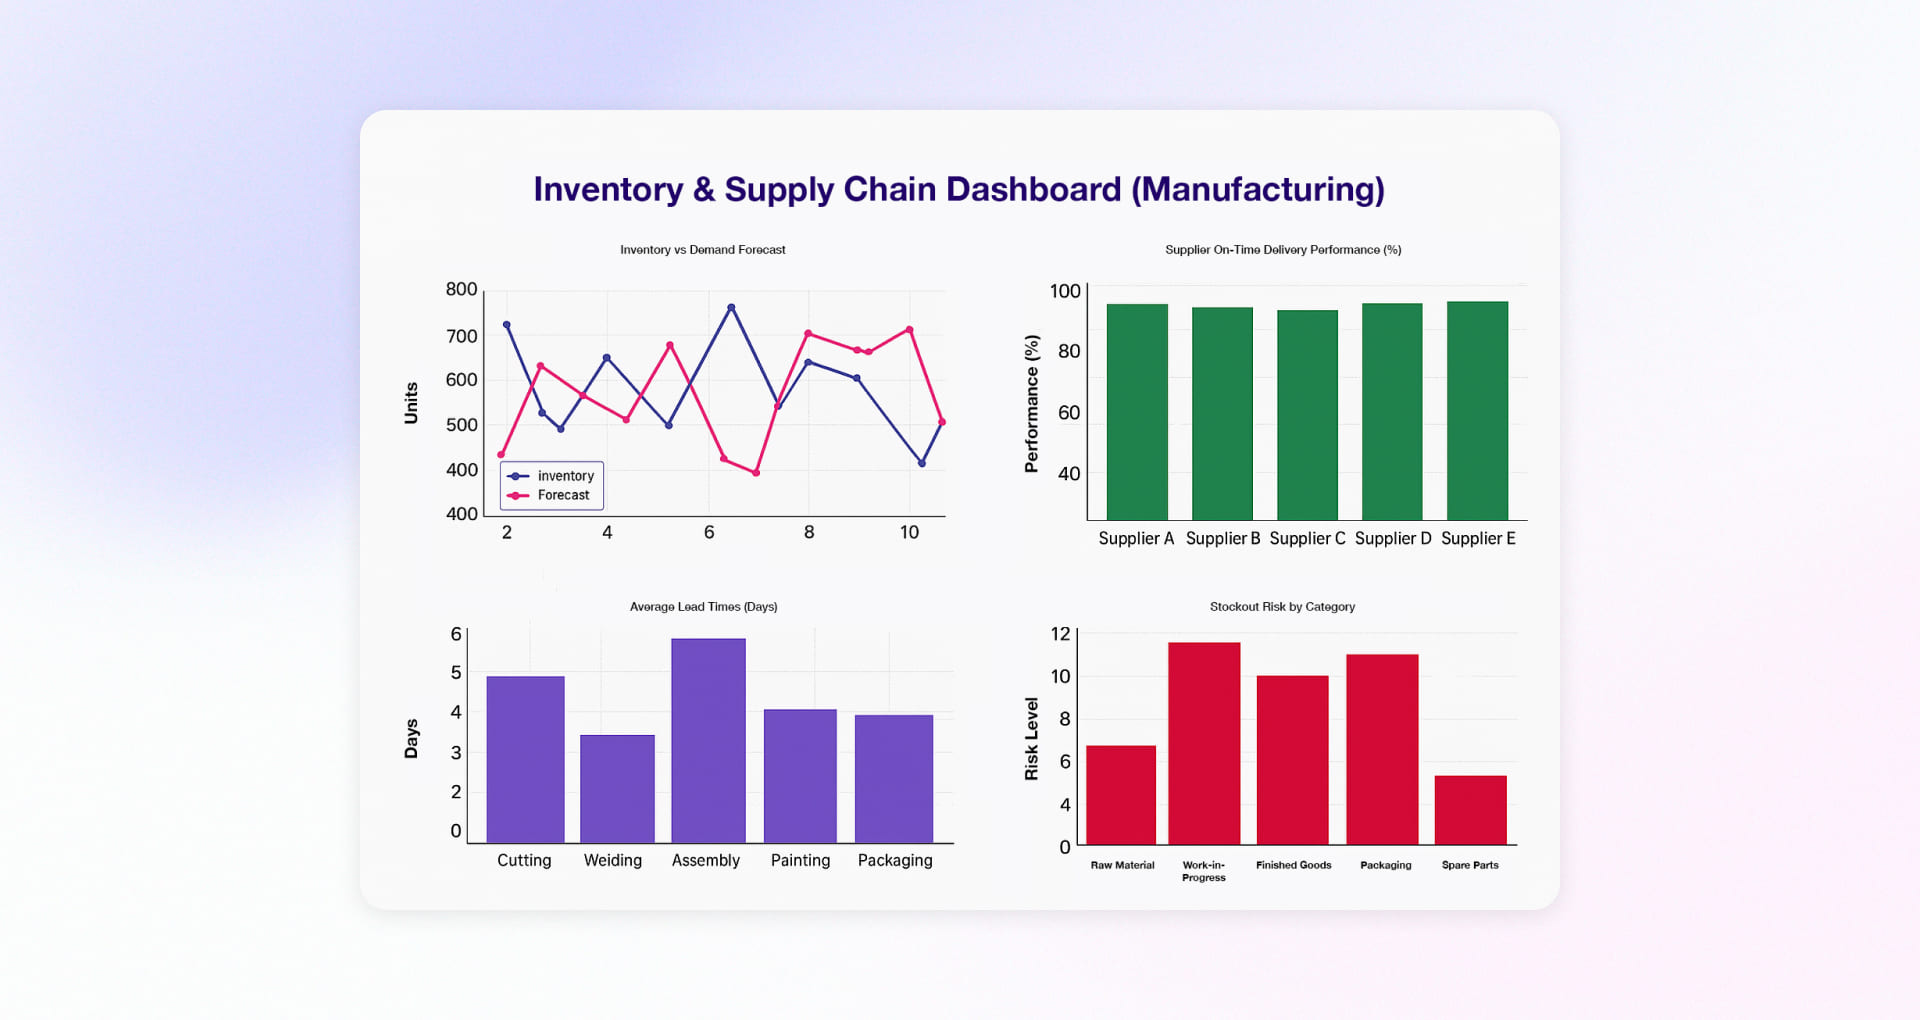
Here is the example of dashboard for inventory and supply chain gives manufacturers the full picture of their operations, from stock levels to supplier reliability and demand forecasts. In supply chains, timing is everything, and this dashboard makes sure you’re not “caught napping” when shortages hit or “left holding the bag” with excess stock. By keeping “all your ducks in a row,” it helps you stay ahead of delays, cut risks, and ensure the right materials are always in the right place at the right time.
Together, these insights help manufacturers:
- Anticipate demand fluctuations with greater accuracy
- Reduce stockouts and excess inventory
- Improve supplier performance and reliability
- Shorten lead times to maintain smooth production flow
Cost & Financial Dashboard
Financial functions and informed decision-making on all aspects that directly or indirectly impact the financial or cost line of manufacturing should be closely monitored. A Power BI-enabled dashboard with a wide range of data visualization capabilities, including real-time updates, can make this process even better and more efficient.

This Power BI dashboard offers a clear view of a manufacturing business’s financials. It tracks Revenue vs. Production Costs, Profit Margin trends, departmental expenses, and cost distribution across Raw Materials, Labor, Utilities, Maintenance, and Others, helping identify key cost drivers and areas for efficiency.
Together, these insights help manufacturers:
- Identify high-cost areas and control overspending
- Optimize profit margins by tracking revenue vs. costs
- Allocate departmental budgets more effectively
- Make informed financial decisions to improve overall profitability
Common Challenges in Manufacturing Without Power BI
Challenges in the manufacturing industry are real and constantly growing. However, here we will specifically focus on how the absence of Power BI creates obstacles for manufacturers and their teams.
Challenge 1: Limited Visibility into Operations
Traditional manufacturing operations have been too siloed in terms of system usage and applications, which means there is no real-time information on ongoing processes, operations, or the entire workflow across departments. This leads to inefficiencies in operations, lack of managerial oversight, missed deadlines, compromised quality, and escalating costs.
Power BI bridges this gap by consolidating data from multiple sources into intuitive dashboards, enabling managers to monitor operations proactively and respond immediately to bottlenecks.
Challenge 2: Inefficient Financial Management
Manual data collection and generating reports manually often feel disconnected from one operation to another. There are too many blind spots to cover and too much effort required to analyze costs, revenue, and profits. Many risks can easily slip through unnoticed.
Power BI empowers finance teams with real-time visibility into financial performance, offering actionable insights that optimize budgeting, reduce cost overruns, and improve margins.
Challenge 3: Delayed Decision-Making
Every big win depends on the wise decisions that manufacturers and business leaders make. But without data, real-time insights, and with information stored in spreadsheets or scattered across different parts of the system, strategic decisions are nearly impossible. What do you miss then? Opportunities to stay ahead of the competition, customer-centric insights, and many other hidden advantages.
Power BI transforms raw data into interactive visualizations, enabling decision-makers to act quickly, forecast accurately, and maintain a competitive edge.
Challenge 4: Lack of Predictive Insights
Advanced analytics is adoption, you just need to integrate the right Power BI solution and collaborate with the right Microsoft partner, such as Rishabh Software. Without advanced analytics, manufacturers risk falling behind when faced with demand fluctuations, supply chain disruptions, and more.
Power BI integrates predictive analytics, leveraging historical and real-time data to provide forecasts and actionable recommendations, allowing manufacturers to plan ahead and mitigate risks effectively.
Harness the Power of Data Analytics and Business Intelligence with Rishabh Software
Our certified Microsoft experts help manufacturers unlock the full potential of Power BI by transforming their operational data into assets. From consulting to deployment, our end-to-end Power BI consulting and Power BI development services help manufacturers streamline production, create more resilient supply chains and unlock innovations. As your trusted development partner, we have an expert team to tailor Power BI to your manufacturing needs. We help you with automated reports, predictive analytics, custom dashboard, and more to transform your data into smart visuals with interactive dashboards.
Takeaway:
As manufacturing companies look for new ways to accelerate production and automate industrial processes, Power BI for manufacturing presents an easy and effective solution to overcome complex issues and expedite growth.
Industry 4.0 is transforming manufacturing by incorporating big data analytics, IoT, and Artificial Intelligence to improve cost efficiency and productivity. Power BI empowers manufacturers by helping find the most important manufacturing KPIs and visualizing data in interesting and insightful ways.
Frequently Asked Questions
Q: Why is Power BI better than other visualization tools?
A: Power BI offers many advantages compared to other data visualization and Business Intelligence tools. Here are five reasons why Power BI is popular and ranked among the top by Gartner Magic Quadrant:
- User-friendly UI: Simple and easy-to-use interface offers a drag-and-drop interface to create dashboards and reports.
- Integration with Microsoft: The seamless integration within the Microsoft ecosystem makes it easy to import and consolidate data from Microsoft Excel, Azure, SQL Server, SharePoint, Outlook, and Teams.
- Affordable: Power BI is a free version with limited features for the average user. The premium version is available at a flexible price point that is comparatively lower than other BI models. Thus, it is also an attractive choice for small and mid-tier businesses.
- Many Out-of-the-box features and Constant Upgrades: Power BI offers class-leading features like data modelling, DAX, and seamless connectivity to third-party applications and data sources. It also provides a data modeling engine that allows users to create data models which can be used across different reports and dashboards. Microsoft also regularly adds new features every month to remove any glitches or limitations of the tool.
- Scalability: As a cloud-based architecture, it offers robust and instant scalability, thus allowing users to scale on demand and efficiently handle large volumes of data from different sources.
Q: Is Business Intelligence and Manufacturing Analytics the Same Thing?
A: Business Intelligence refers to software, techniques, and tools to transform raw unstructured data into meaningful insights. It allows businesses to quickly analyze data and generate actionable business insights to make data-driven decisions. Popular BI tools include Microsoft Power BI and Tableau.
Manufacturing analytics is a subset of Industry 4.0 and aims at leveraging predictive analytics, big data, and the industrial Internet of things for better visibility into the plant floor. Manufacturing Analytics is the process of collecting data from many different sources in the manufacturing environment, such as people, machines, operational, and system data. Compiling it in an easy-to-understand format to ensure quality, increase performance and yield, reduce costs, and optimize supply chains.
Q: How can Power BI dashboards be tailored for different roles?
- Executives: Big-picture KPIs, company goals, and overall business status.
- Managers: Team performance, budget tracking, and process effectiveness measures.
- Analysts: In-depth data sets with options to dig deeper for thorough examination.
- Frontline Staff: Easy-to-read dashboards centered on everyday tasks and operations.
- Role-Based Access: Custom views that show the data each role needs to see
Footnotes:
3. https://finance.yahoo.com/news/enterprise-manufacturing-intelligence-global-market-143800095.html
4. https://www.gartner.com/doc/reprints?id=1-2CF2LJQ8&ct=230130&st=sb
5. https://reprints2.forrester.com/#/assets/2/108/RES178493/report
8. https://customers.microsoft.com/en-us/story/1649821336795746652-sandvik-coromant-chemicals-power-bi