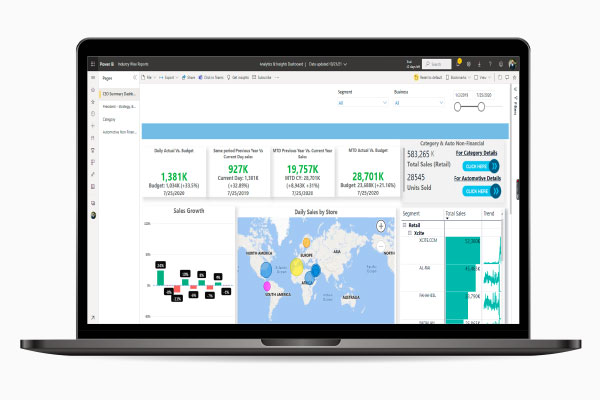
Learn how we helped a Middle East-based retail giant develop an easy-to-navigate insights dashboard by leveraging Microsoft Power BI. It enables the organizational leadership with holistic monitoring of sales KPIs as they require. The key insights they could extract would include budget spend reporting, sales growth coverage, industry/sub-industry segmenting and more.
Project Overview
The Kuwait-based retail brand operating across 40 countries with multiple business units was in pursuit of a business intelligence services company. They wanted to create a holistic solution that offers a 360° view of business sales performance. The advanced Power BI sales reporting system covers important metrics such as profit margin, sales performance segregated by region, and industry segment for both short and long term with forecasting to enable informed decision-making.
Challenges
- Managing manual & multiple excel-spreadsheets for numerous stores across various locations was time-consuming
- Lack of mechanism to track, monitor KPIs over a single platform to make informed decisions
- No proper 3rd party integration of data resources for visualization
- Managing of categories and on disparate IT systems
Solution
We developed a sales dashboard in Power BI that helps the organizational leadership with holistic monitoring of all the key sales KPIs. They can extract meaningful insights for business, track/modify strategies by looking at accurate forecasts provided by the dashboard.
It enables leadership teams (including CEO & head of business units) and sales managers an overview of performance – sales per segment/category, region, units sold, trends from YoY sales, along with granular details relating to each opportunity. Additionally, all metrics are presented in a high-level format to help top leaders identify areas of focus. Further, we even assisted with the seamless integration of various applications to provide a single source of truth.
The Power BI dashboards and reports for sales and inventory are organized in a simple, easy-to-navigate structure that allows users to quickly find the reports & analytics as they require.
Key insights for this dashboard include;
1. CEO Summary Dashboard
Allows the leadership team to identify what channels require additional focus for YoY budget planning & performance. Key stats to gauge performance vs benchmark stats – metrics include;
- Daily sales (by region)
- Growth estimate (by date range)
- Segment performance
- Forecast vs Performance mapping


2. Strategy Dashboard
Helps teams to understand the dynamics of their sales business across segments with custom filters. Allows performance tracking in real-time to take key business decisions and align strategy as required.
Key metrics include;
- Revenue mapping (by business segment)
- Sales analysis (by growth vs by business segment)
- Segment-based variation mapping (CY vs PY number with growth vs budgeted/targeted segment)
- Sales trend forecast (YoY)
3. Sales Strategy Dashboard
Help sales leadership gauge an overview of their current sales position.
- Area Chart – Sales & Opportunities by month helping them measure the flow of deals by month.
Benefits
- 100% visibility into sales operations for trend/milestone mapping
- YoY segment- & region-wise sales statistics over defined time & metrics
- Over 40% forecast accuracy of future KPIs
- 4x improvement in effective decision making
Customer Profile
A Middle East-based Retail Company
Technologies
Power BI


 30 Min


