
Every business wants faster insights, trustworthy dashboards, and better decisions. Yet many organizations still struggle with conflicting reports, inconsistent KPIs, and BI dashboards that answer simple questions differently depending on who created them.
The problem usually isn’t the BI platform itself. Whether you are using Power BI, Tableau, Looker, or another analytics tool, the quality of insights depends on the quality of the data foundation behind it. Without a well-designed data warehouse, business intelligence often becomes slower, less reliable, and increasingly difficult to scale.
Data warehousing for business intelligence creates that foundation by integrating data from multiple systems, standardizing business definitions, preserving historical information, and preparing data for fast analytical queries. Instead of spending time reconciling spreadsheets or questioning reports, teams can focus on making decisions with confidence.
- The global business intelligence market is projected to grow from $41.16 billion in 2026 to $62.38 billion by 2031, at a CAGR of 8.67%.
- The broader business analytics market is projected to increase from $98.84 billion in 2026 to $149.47 billion by 2031, at a CAGR of 8.62%.
- The global data warehousing market is expected to grow from $24.79 billion in 2026 to $44.42 billion by 2035, registering a CAGR of 6.6%.
In this blog post, we will walk you through why data warehousing for business intelligence matters more than most teams give it credit for, what a decent data warehouse architecture actually looks like, where BI in a data warehouse pays off in practice, and how teams manage to wreck it anyway.
How Modern Data Warehousing Strengthens BI Solutions
Data is essential, and the quality of data presentation makes all the difference between successful and failing business performance for CEOs and managers. The way this information is stored and processed is crucial, which largely depends on the data warehouse structure and the degree of complexity that the system introduces.
Business intelligence tools can exist without a data warehouse, but in such cases there is a need for the application to connect to various sources and perform more operations to obtain and prepare data. As the number of sources increases, managing them and ensuring the accuracy of the information obtained becomes more complex.
Modern data warehousing for business intelligence aims to separate operational data from analytical data, thus solving some of these problems. Let’s discuss how the implementation of such a system can strengthen a BI solution.
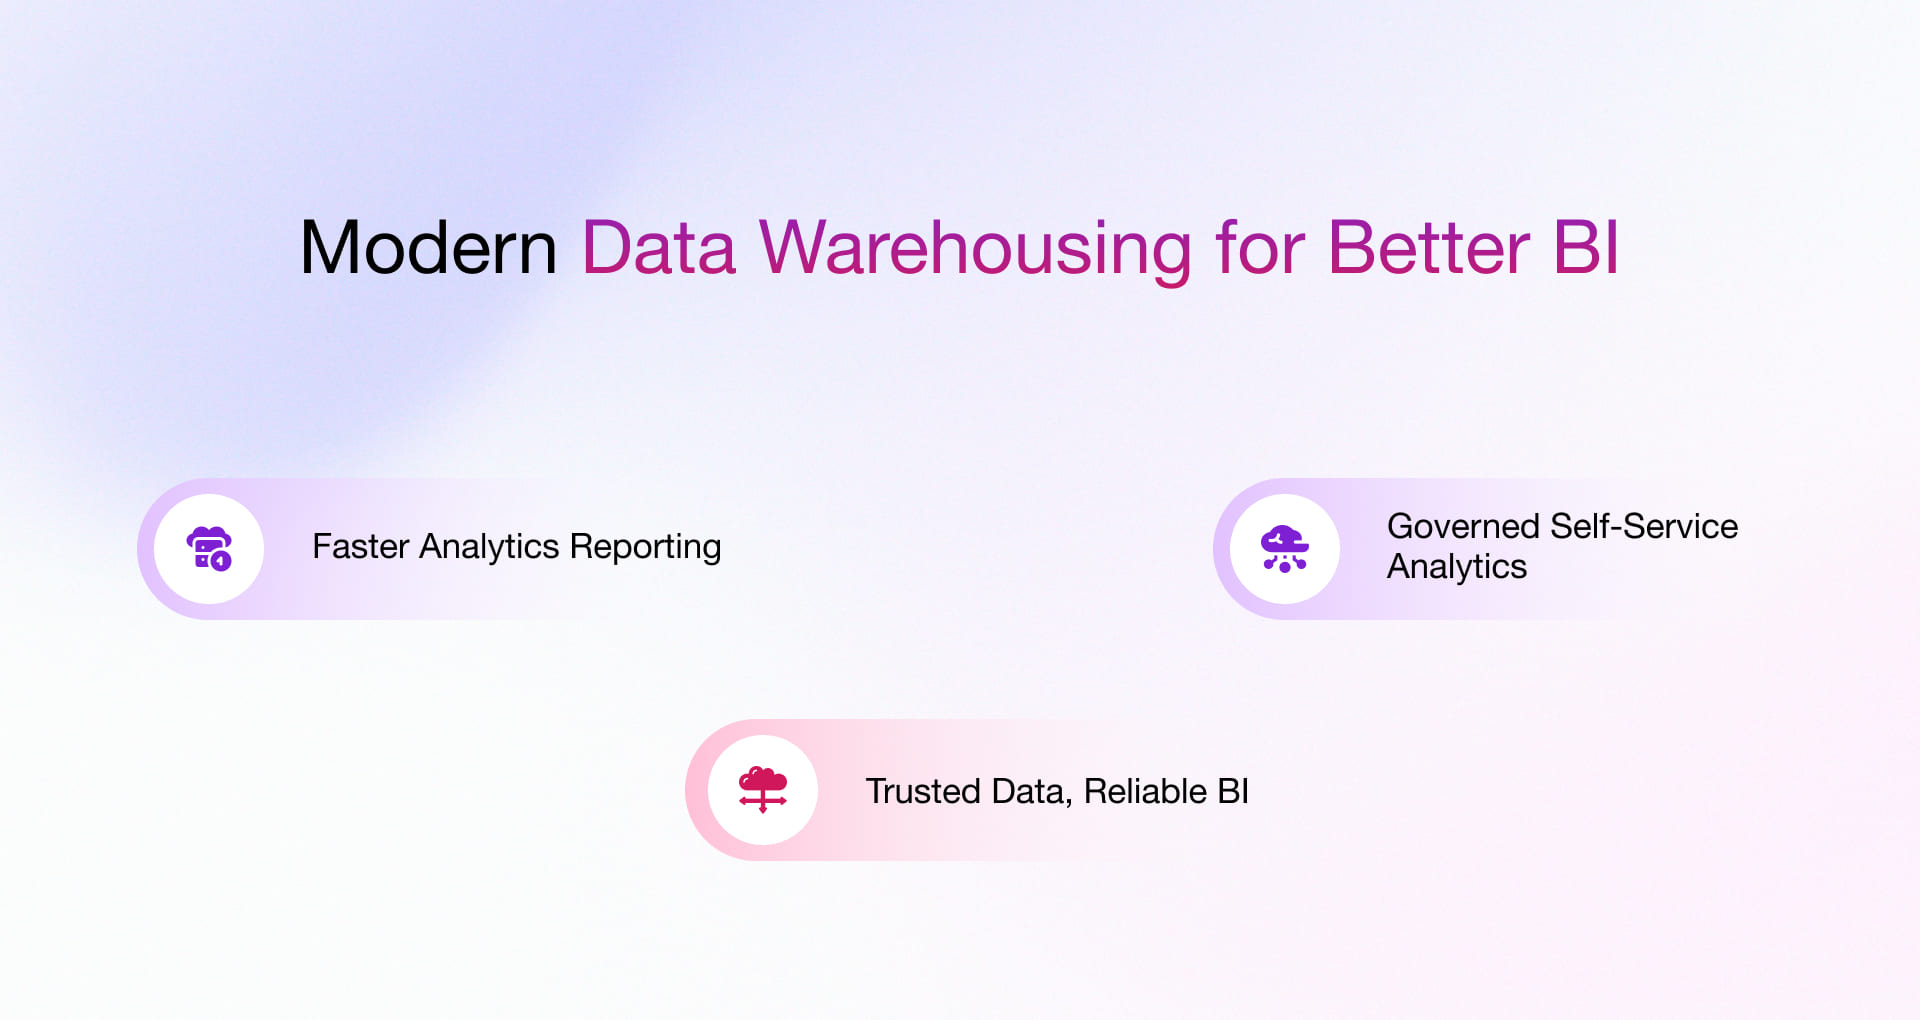
Faster Reporting Starts with an Analytics-Optimized Architecture
Operational applications typically run on OLTP databases designed to process transactions, not complex analytical queries across years of historical data. When organizations simply pass high-intensity extraction requests to production systems, both reporting performance and operational efficiency suffer.
A modern data warehouse shifts analytical workloads away from transactional systems. Through ETL or ELT pipelines, data is extracted from multiple sources, transformed into a query-ready structure, and loaded into fact and dimension tables. Depending on the analytical requirements, these models use a star schema or snowflake schema, enabling BI platforms to retrieve information more efficiently.
The right data warehouse tools can also provide preconfigured integration, transformation, and query-optimization capabilities. This helps teams move quickly and establish a scalable reporting foundation without affecting daily operations.
Reliable Business Intelligence Depends on Trusted Data
Finance calculates revenue differently from sales. Marketing may define an active customer differently from customer success. Each definition may be valid on its own. Together, they reduce trust in BI and data warehouse reporting.
A modern warehouse establishes consistency before information reaches the BI layer. During transformation, duplicate records are consolidated, formats are standardized, and missing values are addressed. A semantic layer applies shared definitions to metrics such as revenue, churn, and active customers. Metadata management preserves lineage, making it easier to trace a figure back to its source.
Revisiting data warehouse architecture thoughtfully can reveal weak data points and opportunities to improve the wider data-delivery process. This is also where structured data warehouse development starts to pay off, since modeling, governance, and pipeline decisions directly affect the quality of BI outputs.
Self-Service Analytics Requires Governance
Organizations want to establish “self-service” options for business users, but flexibility cannot come at the expense of consistency.
Data marts provide business functions with curated datasets aligned with their reporting needs. Role-based access controls ensure that users see only the information relevant to their responsibilities. Teams can work in Power BI, Tableau, or Looker without navigating the underlying complexity of BI in a data warehouse.
This model can also help establish a data-friendly culture. Users gain quicker access to governed information, while the organization retains control over definitions, security, and data quality. A practical data warehouse solution for hospitality business shows how this architecture can unify distributed information for reporting and analysis in a real industry setting.
Build a Modern Data Warehouse Architecture for BI
A data warehouse architecture should begin with the questions the business needs to answer. It should not begin with tools, platforms, or any other technology receiving the most attention. The starting point is the business itself: its processes, users, measures, dimensions, and reporting needs.
Start With the BI Questions
The first step in business intelligence implementation is to get clear on what people need to analyze.
It could be sales by product and region, campaign performance, operating costs, customer behavior, or profitability. These questions help define the warehouse model:
- Facts represent business events, such as a sale or an order.
- Measures store values such as revenue, quantity, or cost.
- Dimensions add context, such as customer, product, location, and time.
- Granularity decides how much detail BI users can access.
Get these choices right, and BI tools can support drill-down, roll-up, slicing, filtering, and ad hoc analysis without forcing teams to rebuild reports every time a new question comes up.
Connect the Main Architecture Layers
A modern BI and data warehouse setup usually follows a straightforward flow:

Data is collected from a wide range of systems, applications, and business processes. ETL or ELT pipelines clean, transform, and move that data into the warehouse.
From there, data marts and OLAP models organize it for specific BI needs. Reporting, visualization, and cloud business intelligence tools then turn that prepared data into dashboards, KPIs, and analysis.
This is the point where separate systems start to feel like one reporting environment.
Choose a BI-Friendly Data Model
A warehouse built for BI usually relies on multidimensional modeling. Fact tables hold measurable business events. Dimension tables explain those events by adding details such as time, customer, product, or region.
A star schema keeps things simple and often makes BI queries faster. A snowflake schema can support more detailed structures, though it also introduces more joins and complexity.
The right choice depends on how users explore information and how easily the data warehouse in business intelligence needs to support new questions.
Keep Definitions Consistent Across BI Reports
Different data marts can easily create different versions of the same business. One team may define revenue one way. Another may use a slightly different rule. Both reports may look correct, but they won’t match.
Conformed dimensions and shared fact definitions help sales, finance, marketing, and operations work with the same customer, product, time, revenue, and cost logic.
This is where data warehousing and business intelligence become closely connected. Business intelligence consulting services can help align those definitions with reporting goals before inconsistent metrics spread across dashboards.
Plan for BI Performance and Growth
BI users expect reports to load quickly, even when the warehouse contains years of history. Partitioning, aggregates, materialized views, and OLAP cubes can help reduce query time.
The architecture should also leave room for new sources, measures, dimensions, data marts.
A warehouse built only for today’s dashboards usually becomes a problem later. A thoughtful data warehouse implementation gives the BI solution clean data, shared definitions, historical depth, and enough flexibility to grow with the business.
Real-World Business Use Cases of Data Warehousing and BI
When data warehousing and business intelligence come together, they can support a wide range of outcomes across departments and industries. The use cases below are only a few examples of what a well-connected data warehouse and BI solution can enable.
Explore the list, and if you have a more specific or unusual requirement, write to us at sales@rishabhsoft.com.
1. Unified Sales Performance Reporting
Sales data is distributed across CRM systems, ERP platforms, e-commerce applications, and partner channels, making it difficult to measure revenue accurately.
What the Data Warehouse Does:
- Integrates data from multiple sales systems
- Standardizes revenue metrics
- Creates a single view of customers and products
Executives can analyze sales by region, product, channel, and customer segment using one trusted dashboard instead of reconciling multiple reports.
2. Marketing Performance and Customer Analytics
Marketing teams generate data from advertising platforms, websites, CRM, email campaigns, and social channels. Without integration, measuring campaign ROI or customer acquisition cost becomes difficult.
A modern data warehouse consolidates first-party and campaign data, enabling BI platforms to analyze:
- Customer acquisition cost (CAC)
- Conversion funnels
- Campaign ROI
- Customer lifetime value (CLV)
- Multi-touch attribution
3. Financial Planning and Executive Reporting
Finance depends on timely, accurate, and consistent information. When FinTech data resides across ERP systems, procurement tools, payroll applications, and operational databases, month-end reporting becomes slower and reconciliation efforts increase.
A modern data warehouse creates a governed financial data layer that supports:
- Revenue reporting
- Profitability analysis
- Budget vs. actual performance
- Cash flow monitoring
- Executive scorecards
4. Operations and Supply Chain Intelligence
Operational decisions rely on data from inventory systems, production platforms, logistics providers, and procurement applications.
A centralized warehouse enables BI teams to monitor:
- Inventory turnover
- Order fulfillment
- Production efficiency
- Supplier performance
- Delivery timelines
5. Manufacturing Performance Monitoring
Manufacturers generate data from MES, ERP, IoT devices, quality management systems, and maintenance applications.
Modern data warehousing consolidates these operational datasets into a unified analytical platform, allowing BI solutions to measure:
- Overall Equipment Effectiveness (OEE)
- Machine utilization
- Production throughput
- Defect rates
- Predictive maintenance trends
Three Common Data Warehouse-BI Integration Pitfalls
Integrating a data warehouse with business intelligence tools or solutions offers several benefits. However, combining the two also comes with a few common challenges. Here is a quick look at them.
- Inconsistent Data Across Source Systems
CRM, ERP, finance, and operational systems often store the same information in different formats. If IDs, dates, or refresh cycles don’t align during ETL or ELT, the warehouse may combine records incorrectly and pass incomplete data to the BI layer. - Misaligned Metrics Between the Warehouse and BI Layer
Reports can still conflict even when the data is correct. This usually happens when KPIs such as revenue, churn, or customer count are defined differently across dashboards. A shared semantic layer keeps those definitions consistent. - Overcomplicated Data Pipelines
Too many joins, manual fixes, and one-off transformations make pipelines fragile. A small source-system change can then break several reports at once. Clear lineage, modular logic, and proper monitoring help keep the flow from source to dashboard reliable.
Why Choose Rishabh Software for Data Warehousing and Business Intelligence
Through our data warehouse consulting services, we help mid-sized and enterprise teams design scalable architectures, integrate data from multiple sources, improve ETL or ELT pipelines, align KPI definitions, strengthen governance, and build reporting environments that can support future analytics needs.
We have also developed an in-house BI Agent solution that lets users ask questions in plain English and receive governed answers as charts, tables, or summaries. It connects with distributed data sources and reduces the need to depend on SQL or analysts for routine reporting.
Frequently Asked Questions
Q. How do I know if my organization needs a modern data warehouse instead of optimizing existing BI reports?
A: If your teams spend more time reconciling reports than acting on insights, struggle with inconsistent KPIs across departments, experience slow dashboard performance, or cannot easily onboard new data sources, the issue lies in the underlying data architecture rather than the BI platform.
A data warehouse assessment can help identify whether modernizing the data foundation will deliver better long-term value than incremental BI improvements.
Q: Can we modernize our data warehouse without disrupting existing reporting?
A: Yes. Many organizations adopt a phased migration strategy where the new warehouse runs alongside existing reporting systems until data validation is complete. This approach minimizes operational disruption while allowing teams to gradually transition reports and dashboards.
Q: What do data warehousing and business intelligence enable?
A: Together, data warehousing and business intelligence enable organizations to transform raw data into trusted business insights. They support faster reporting, consistent KPIs, historical trend analysis, forecasting, self-service analytics, executive dashboards, and more informed decision-making across the business.
Q: How do you ensure consistent KPIs across Power BI, Tableau, and other BI tools?
A: Consistency comes from establishing a governed semantic layer, standardized business definitions, conformed dimensions, and centralized transformation logic within the data warehouse. This ensures every BI tool consumes the same trusted metrics regardless of the visualization platform.